Research
Water Insecurity
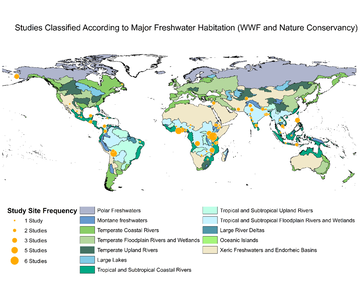
Billions of people around the world are at risk for severe water scarcity at some point within the year. With intensifying climate change, unpredictable weather patterns, and increased extreme hydrological events, it is of great importance for engineers to understand how intra-annual variation, such as weather and seasonality, affect household experiences with water. Understanding these effects has vast social, political, economic, nutritional, and health and human biological consequences. Moreover, it is anticipated the world’s most vulnerable populations will be most affected. We are addressing these challenges by helping engineers better understand the effects of water provisioning systems on the communities they serve amid interannual variation of weather, climate, and seasonality.
Billions of people around the world are at risk for severe water scarcity at some point within the year. With intensifying climate change, unpredictable weather patterns, and increased extreme hydrological events, it is of great importance for engineers to understand how intra-annual variation, such as weather and seasonality, affect household experiences with water. Understanding these effects has vast social, political, economic, nutritional, and health and human biological consequences. Moreover, it is anticipated the world’s most vulnerable populations will be most affected. We are addressing these challenges by helping engineers better understand the effects of water provisioning systems on the communities they serve amid interannual variation of weather, climate, and seasonality.
|
Flood Risk Mitigation and Climate Adaptation
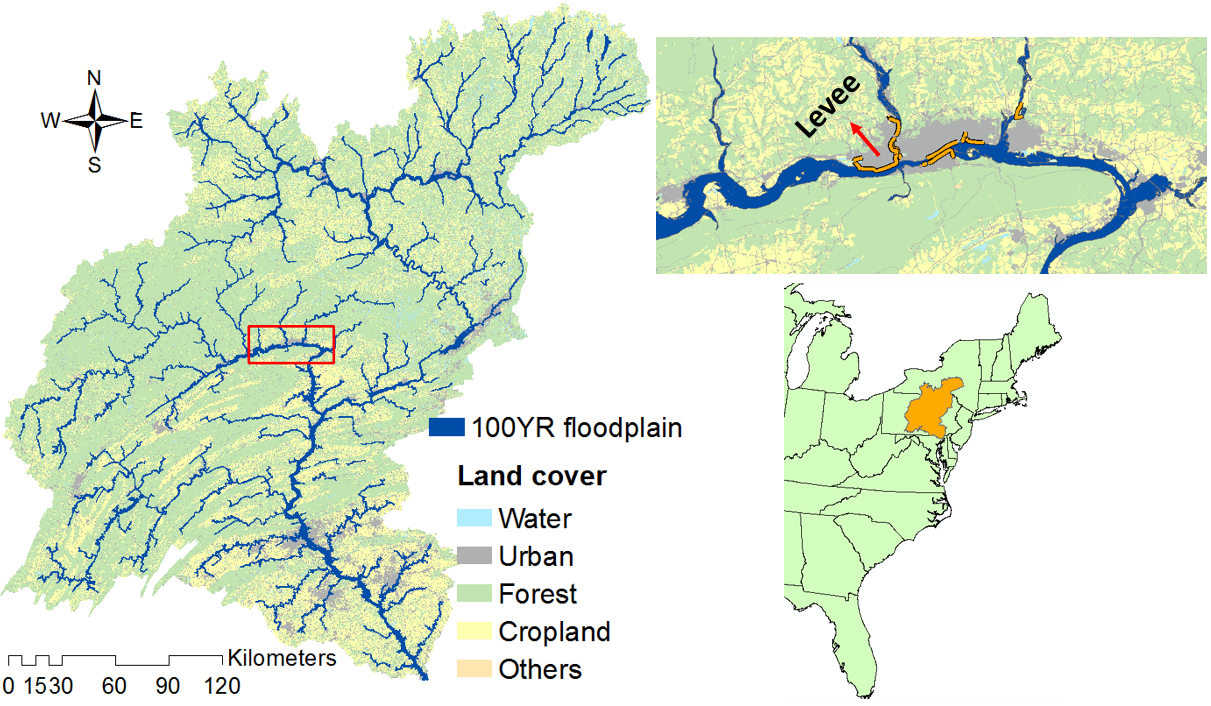
The overarching objective of this research is to develop sustainable strategies for flood risk mitigation and climate adaptation across the Susquehanna River Basin – the main tributary to the Chesapeake Bay. The research is inherently multi-disciplinary and aims to involve decision makers and stakeholders for exploring pragmatic solutions and potential adaptation paths. |
Augmenting Hydrothermal-Cooling System Modeling with ML
We aim to augment a complex hydrothermal-cooling system model with machine learning (ML) to both understand sources of uncertainty within the model as well as improve and reduce uncertainty in the forecast period. Lateral water temperature forecasts are replaced with high-performing ML-based methods, time series for key system boundaries are reconstructed with ML-based methods, and domain and run-time are reduced by exploiting spatiotemporal correlation.
We aim to augment a complex hydrothermal-cooling system model with machine learning (ML) to both understand sources of uncertainty within the model as well as improve and reduce uncertainty in the forecast period. Lateral water temperature forecasts are replaced with high-performing ML-based methods, time series for key system boundaries are reconstructed with ML-based methods, and domain and run-time are reduced by exploiting spatiotemporal correlation.
Resilience and Sustainability of Supply Chain Networks to Water-related Climate Shocks
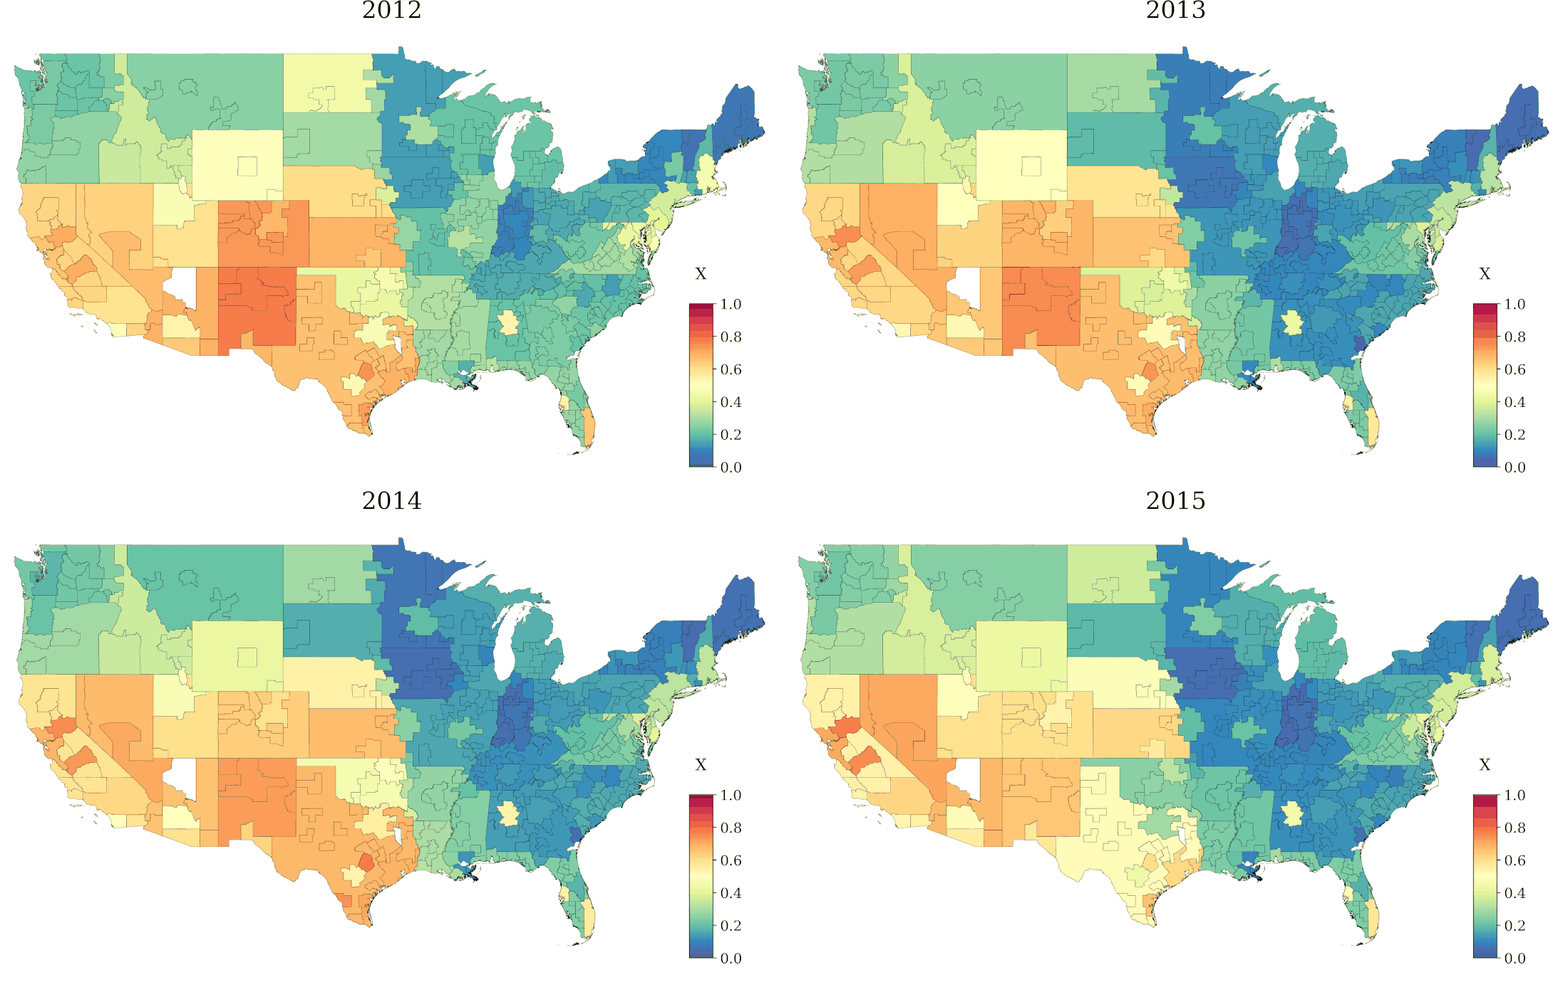
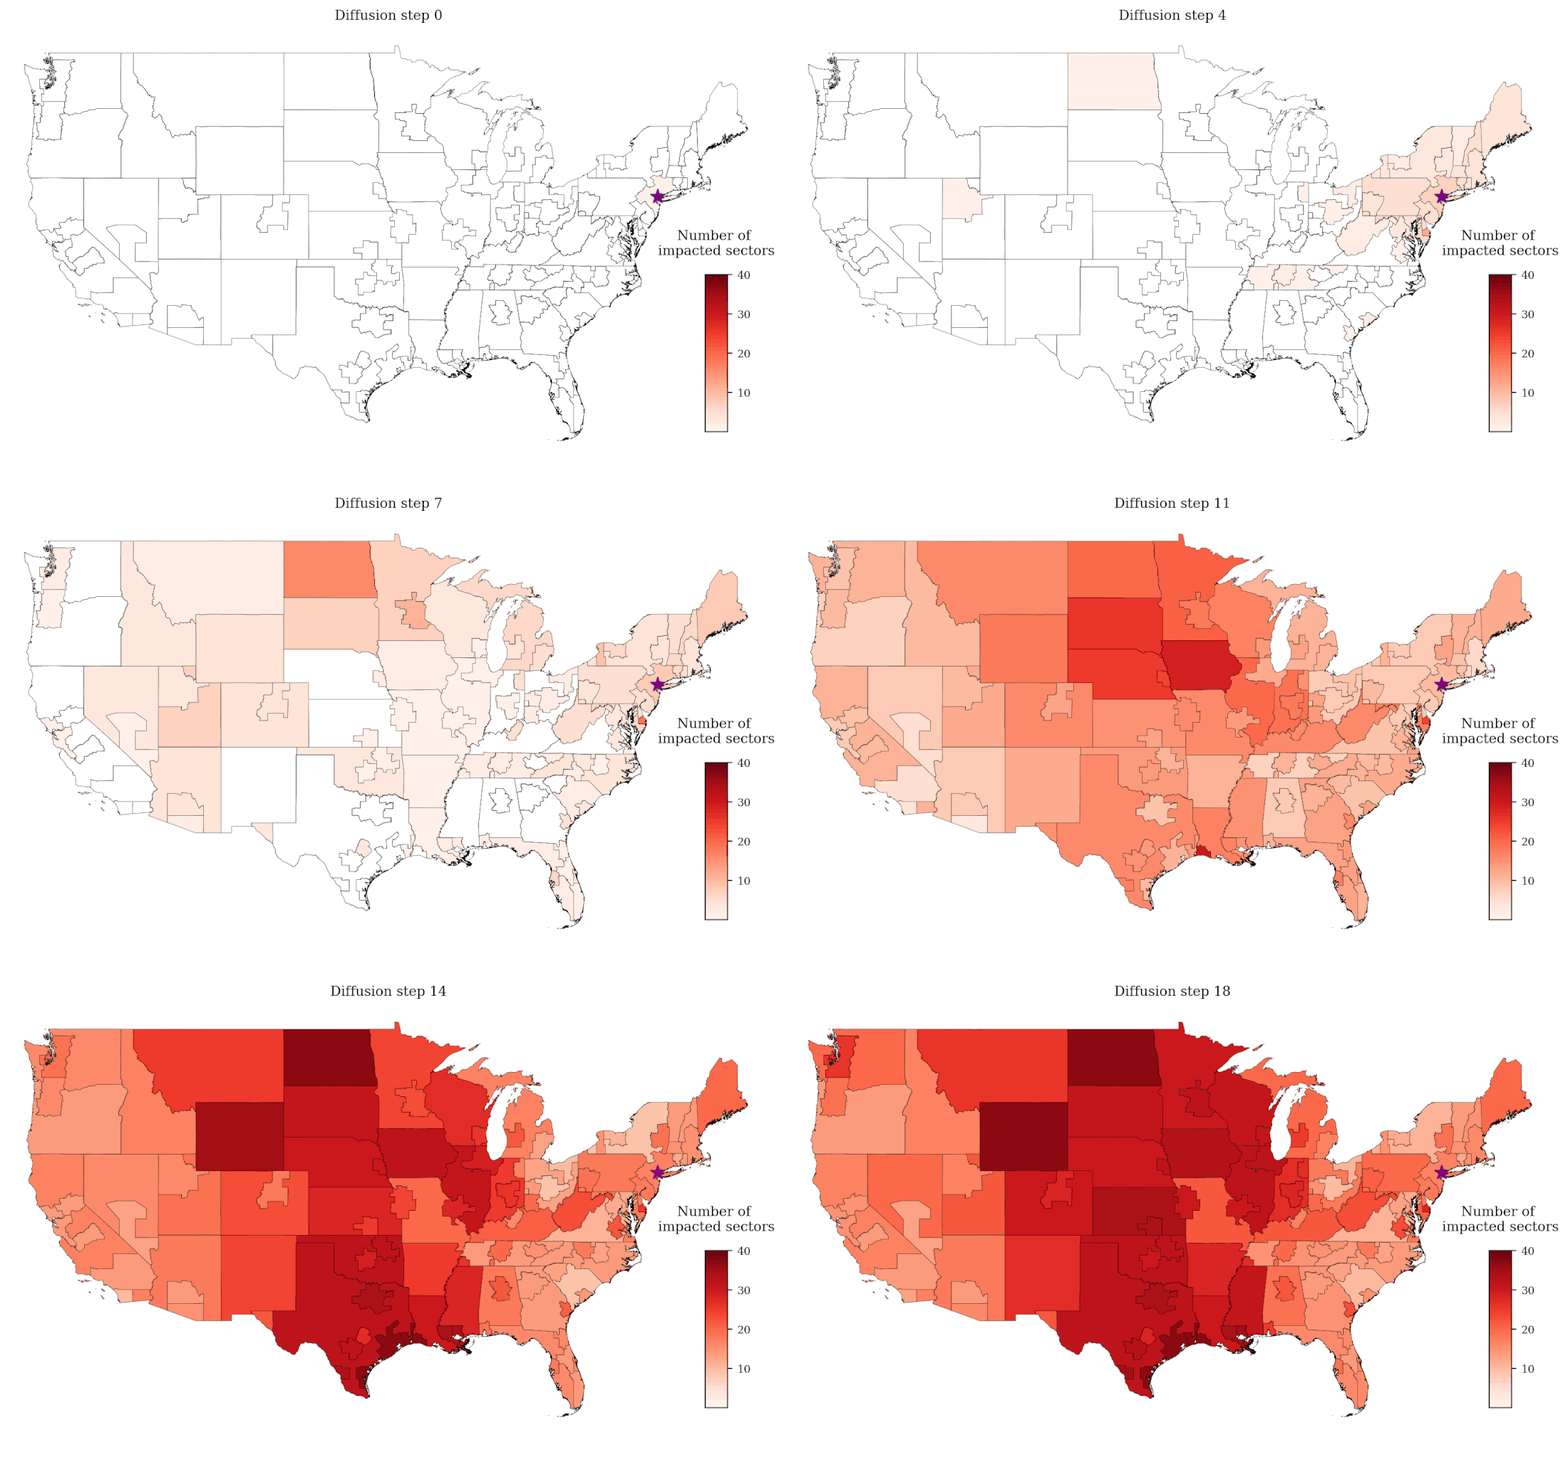
Using network and data science approaches, we are building models for simulating the response of supply chains to water-related disruptions or shocks. We are also testing empirical methods to better quantify supply chain resilience and environmental sustainability that can further be used to judge models and inform decisions. Below, the maps show the food supply chain exposure of U.S. cities and regions to water stress (map with colors), and the spatiotemporal evolution of a supply chain shock starting in New York City and spreading across the U.S. (map with red only).
Using network and data science approaches, we are building models for simulating the response of supply chains to water-related disruptions or shocks. We are also testing empirical methods to better quantify supply chain resilience and environmental sustainability that can further be used to judge models and inform decisions. Below, the maps show the food supply chain exposure of U.S. cities and regions to water stress (map with colors), and the spatiotemporal evolution of a supply chain shock starting in New York City and spreading across the U.S. (map with red only).
